Chart 1.1. SWF Direct Investments: 2015-2018
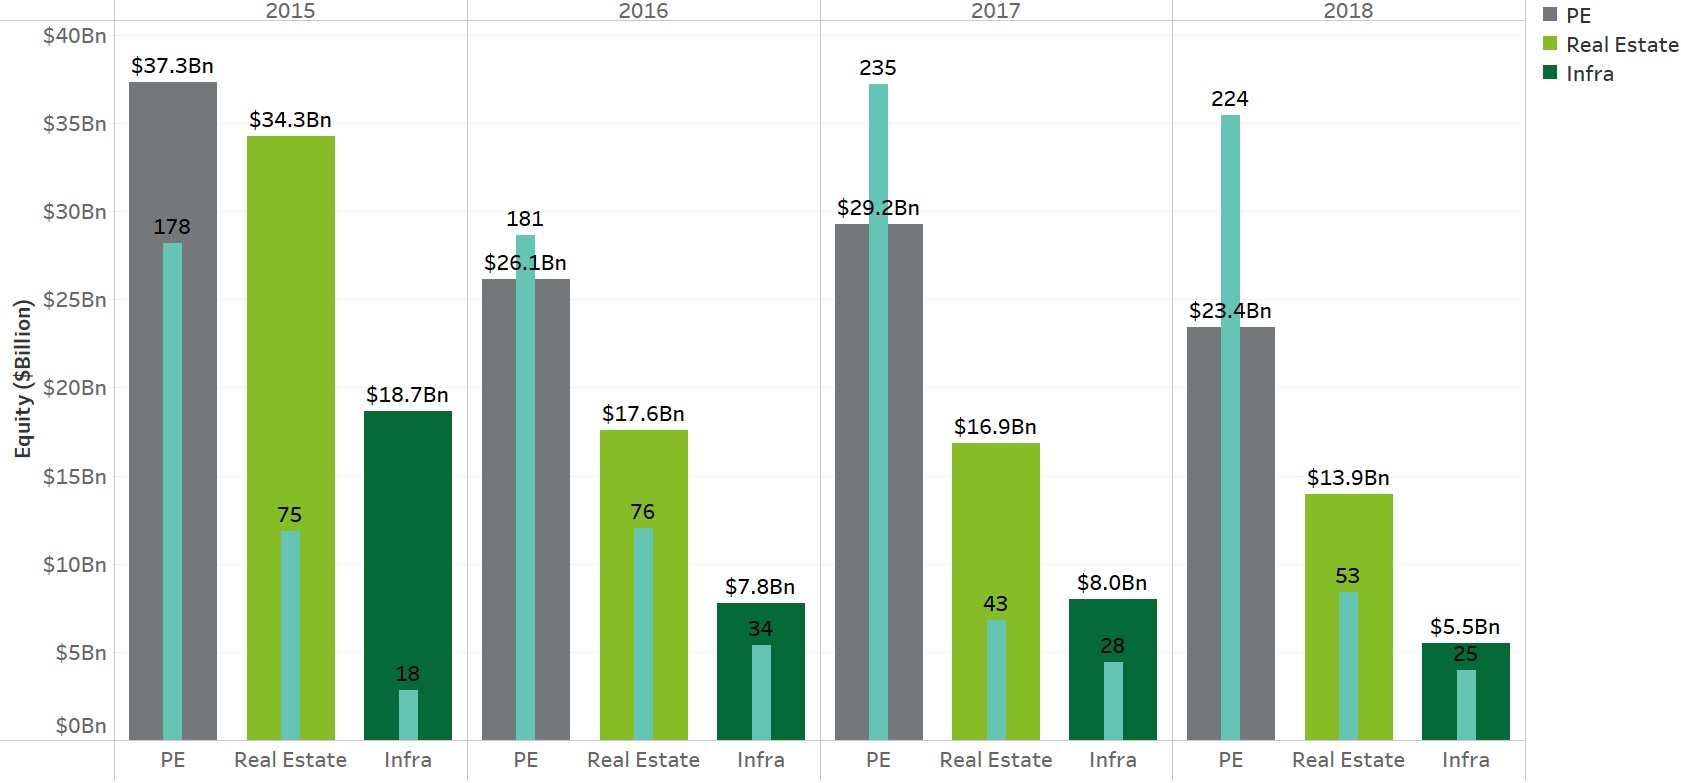
Source: IFSWF Database
Overall, our data reveals that SWFs completed fewer direct equity investments in 2018 than they did in 2017 (224 versus 234). The value of these deals declined by 20% year-on-year – $23.4 billion, compared to $29.2 billion – as SWFs sourced more deals in unlisted companies in innovative sectors with smaller equity cheques. The median equity cheque was similar to 2017 at approximately $25 million, but that is less than half of that in 2016.
Chart 1.2. SWF Direct Investments: Listed vs Unlisted as a % of # of deals
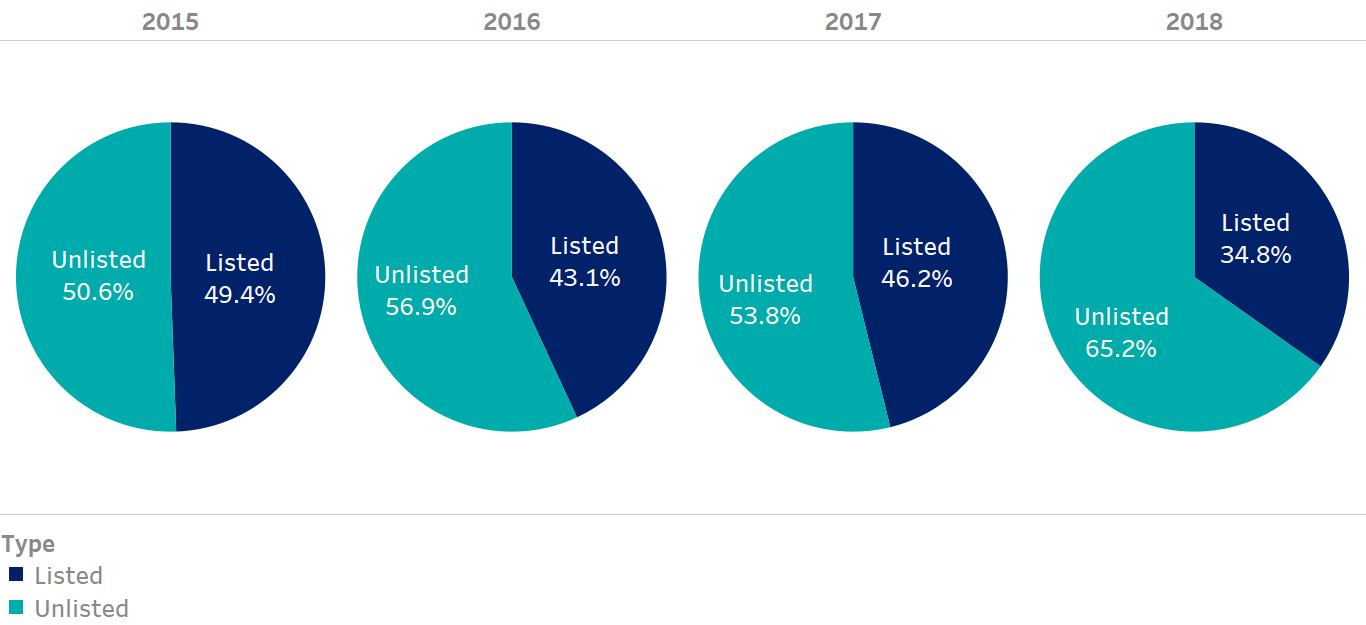
Source: IFSWF Database
The reason SWFs are once more increasing their allocations to unlisted companies is that public markets globally are becoming less liquid. For example, the number of publicly listed companies in the US fell by 50% between 1996 and 2018, from 8,090 to 5,363.3 Declining public market liquidity has a number of causes. First, US tax reforms have spurred a rapid rise in share buybacks. Large US companies announced more than $1 trillion of buybacks in 2018. This trend was led by asset-light firms such as Apple, Alphabet, Cisco, Microsoft and Oracle, but even companies in more traditional industries adopted this tactic to bolster their share prices and earnings per share as current lower-growth environment provides fewer opportunities for capital investing. Share buybacks have been a major driver of stock market returns over the past two years. An analysis of 43 countries’ stock markets between 1997 and 2017 by researchers from the Abu Dhabi Investment Authority (ADIA),4 found that net buybacks – the difference between new stock issues and buybacks – overcome all other factors when explaining stock market returns because they increase the share of corporate profits accruing to existing shareholders and thus increase the price investors are willing to pay for the stock.
Chart 1.3. SWF Direct Investments: Listed vs Unlisted
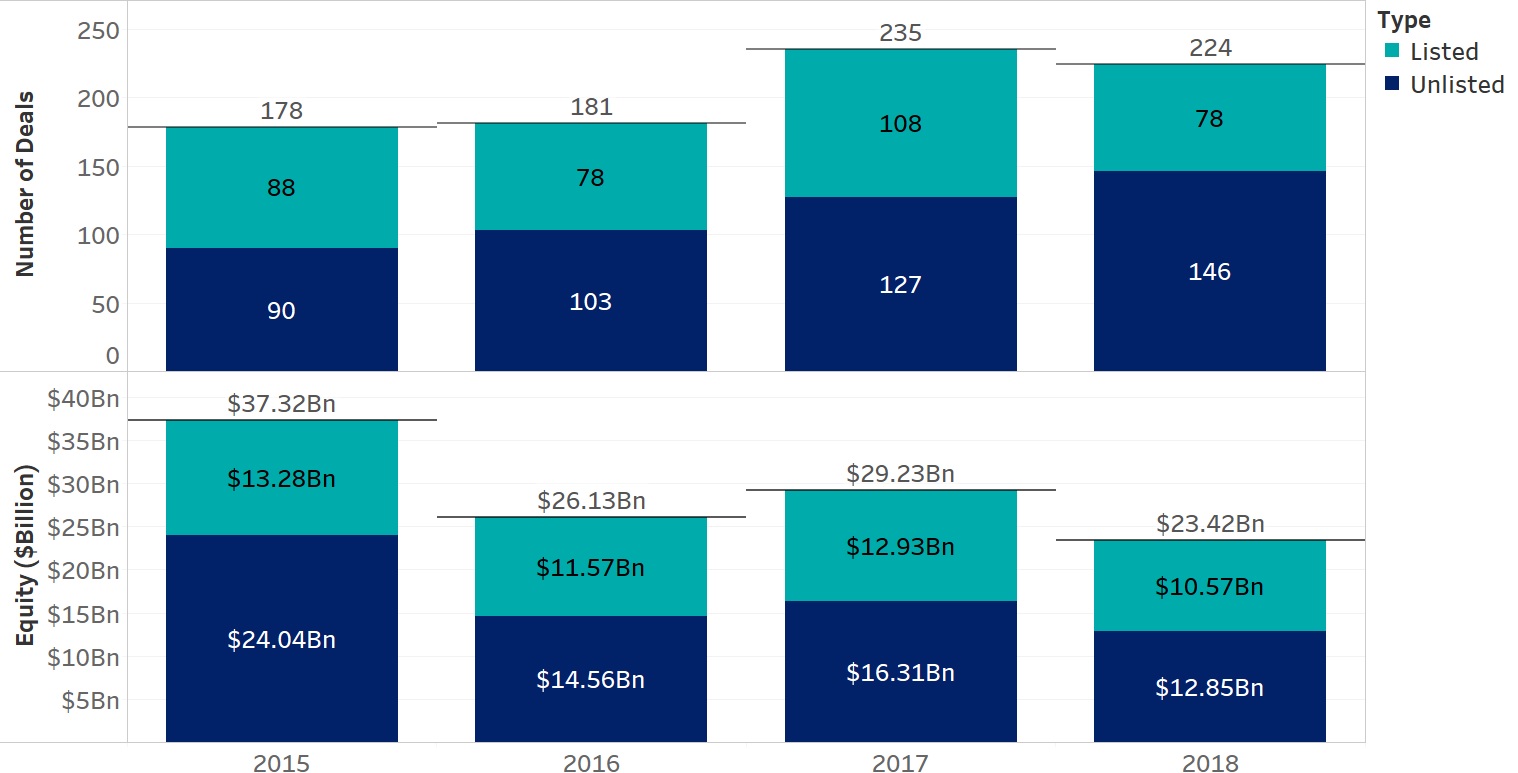
Source: IFSWF Database
Not only are markets witnessing more share buybacks, but also a decline in the global market for initial public offerings (IPOs). As a result, SWFs had fewer opportunities to back as many public-market listings. We observed a record 38 cases of SWFs acting as anchor investors for IPOs in 2017, but less than half that number (17) in 2018, sixteen of which were once again in Asia with 16 out of 17 investments versus an overall regional total of 662.5
Chart 1.4: Sovereign Wealth Fund anchor IPO investments
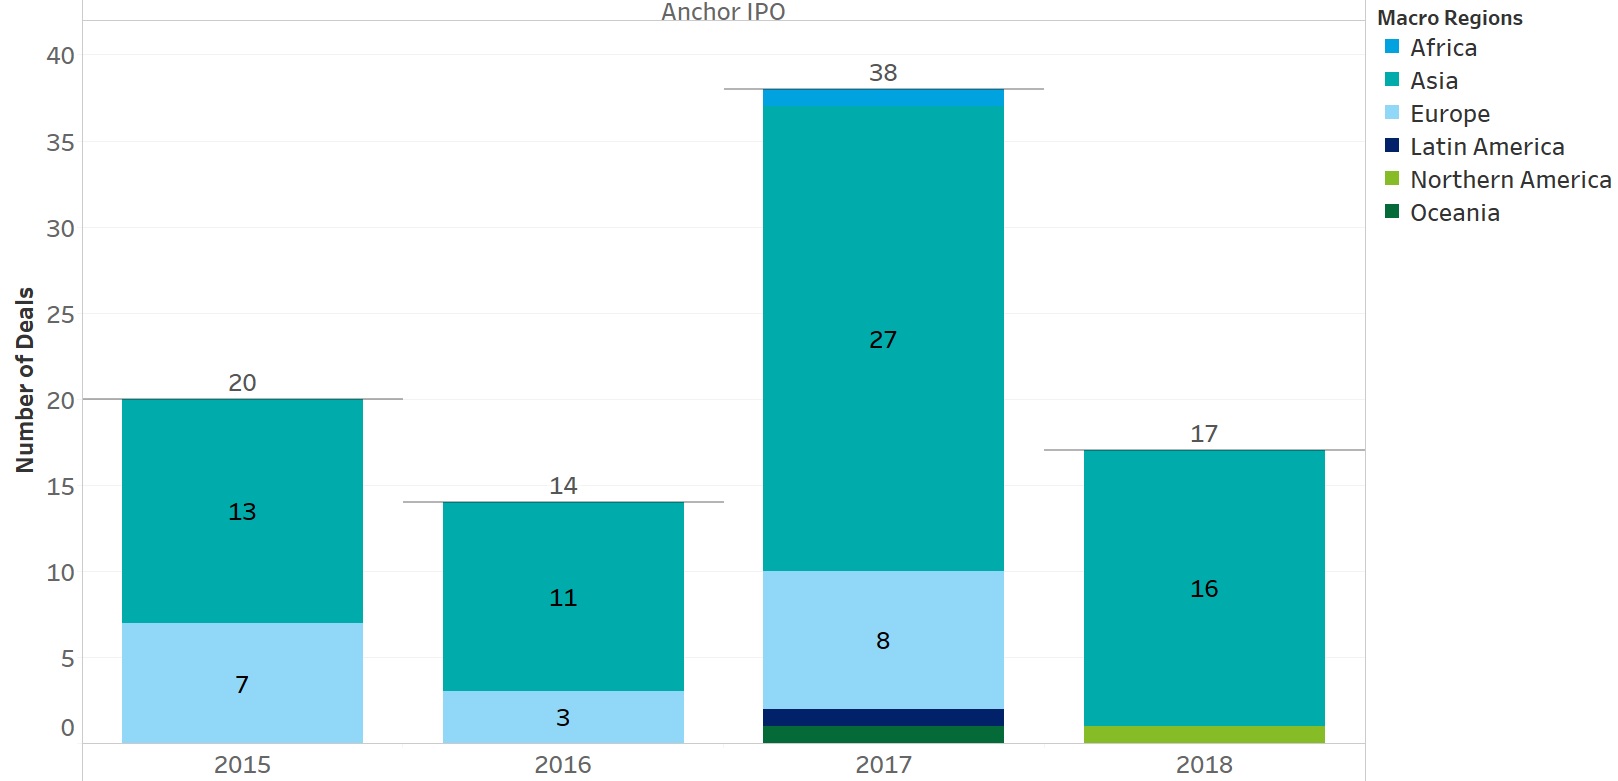
Source: IFSWF Database
A major reason why SWFs are finding fewer opportunities to invest in IPOs is that many innovative tech companies’ business models struggle to turn a profit. Consequently, they prefer to eschew a listing and raise capital from institutional investors, private-equity and venture-capital firms with long-term investment horizons, rather than exposing their results to the quarterly reporting cycle of the public markets. But these are precisely the types of companies in which SWFs are looking to invest, as they have the potential to generate high returns in a generally low-return environment.
The result of new companies shunning public listing is that the secondary market for private equity has become more liquid,6 and investing in private companies at high valuations is less speculative than it used to be. As a result, venture capital is now dominated by large companies raising large amounts of growth capital at valuations once considered for mature companies, which means that returns are more in line with public stocks. Consequently, has become easier for SWFs to deploy capital into unlisted companies.
Chart 1.5: SWF Direct Investments: listed versus unlisted by sector
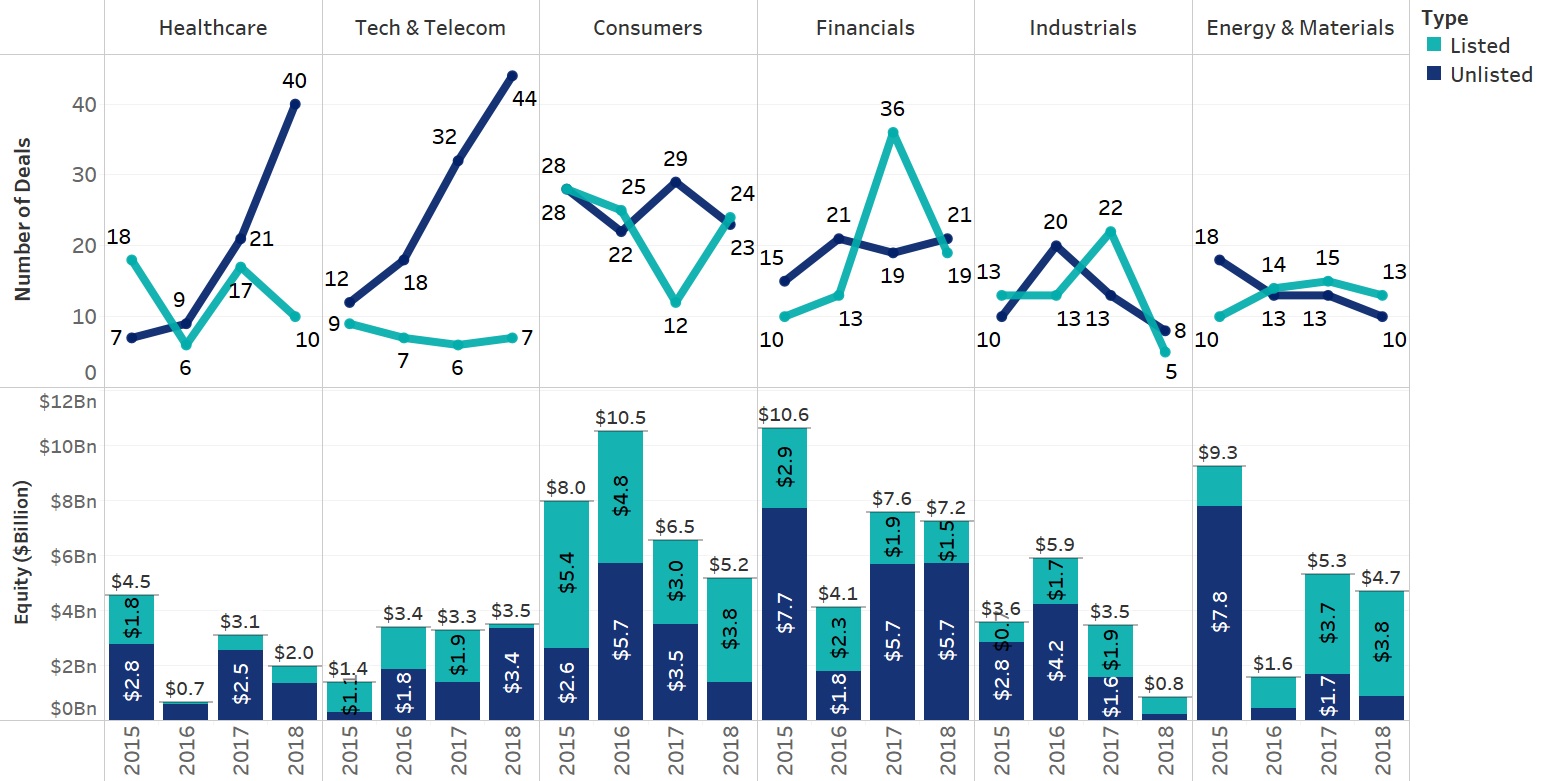
Source: IFSWF Database
Notes
1) This is only the count for private-equity investments. It excludes investments in real estate and infrastructure, which we consider separate asset classes.
2) IFSWF has established a database of SWF direct investments since 2015. Please see methodology for details about data collection and analysis.
3) Data from the world federation of exchanges, accessible at https://focus.world-exchanges.org/issue/march-2019/market-statistics
4) Net Buybacks and the Seven Dwarfs by Jean-François L’Her, Tarek Masmoudi, and Ram Karthik Krishnamoorthy, published by the Financial Analysts Journal (submitted 11 September 2017, accepted 21 June 2018 by Stephen J. Brown)
5) Data provided by the world federation of exchanges, accessible at: https://www.world-exchanges.org/
6) Bloomberg Opinion’s Matt Levine analyses all of these factors in several articles, accessible at: https://www.bloomberg.com/opinion/authors/ARbTQlRLRjE/matthew-s-levine